Codified Observability — Layer 3: Provisioning
This is part 4 of a series based on my DevOpsCon San Diego 2026 talk. Part 3 put the LGTM stack on Nomad. This post is Layer 3 — Provisioning: dashboards and alerts that ship with the service, not weeks later.
The code lives in 3-terraform/ of the devopscon-2026 lab.
The Secondary Step
Infrastructure deploys. The dashboard gets added later. Alert thresholds are set by gut feel and never reviewed. The dashboard only lives in Grafana — not in git. Observability config has no ownership and no history.
A big driver of that pattern is organizational silo. Development teams are measured on shipping services. Operations and reliability teams often lack the context to build the right panels on day one. When dashboards finally appear, they are often built by a single person with no peer review. If someone deletes them in the UI, the setup may be gone for good.
Goal: Observability in the Same Apply
- Grafana dashboards defined as Terraform resources
- Alert rules in the same repo as the service
- Observability reviewed in merge requests like any other change
- If it is not in git, it does not exist
The Pattern from the Talk
A Grafana dashboard resource that templates in values from the rest of the root module — not hardcoded bucket names or DNS records:
resource "grafana_dashboard" "my_app" {
  config_json = templatefile("dashboards/my_app.json", {
    s3_bucket      = aws_s3_bucket.my_app.bucket
    route53_record = route53_record.my_app.fqdn
  })
  folder = grafana_folder.my_app.id
}
Compute, storage, network, and observability sit in one root module. The observability piece is not a follow-up ticket.
Service Provisioning Process
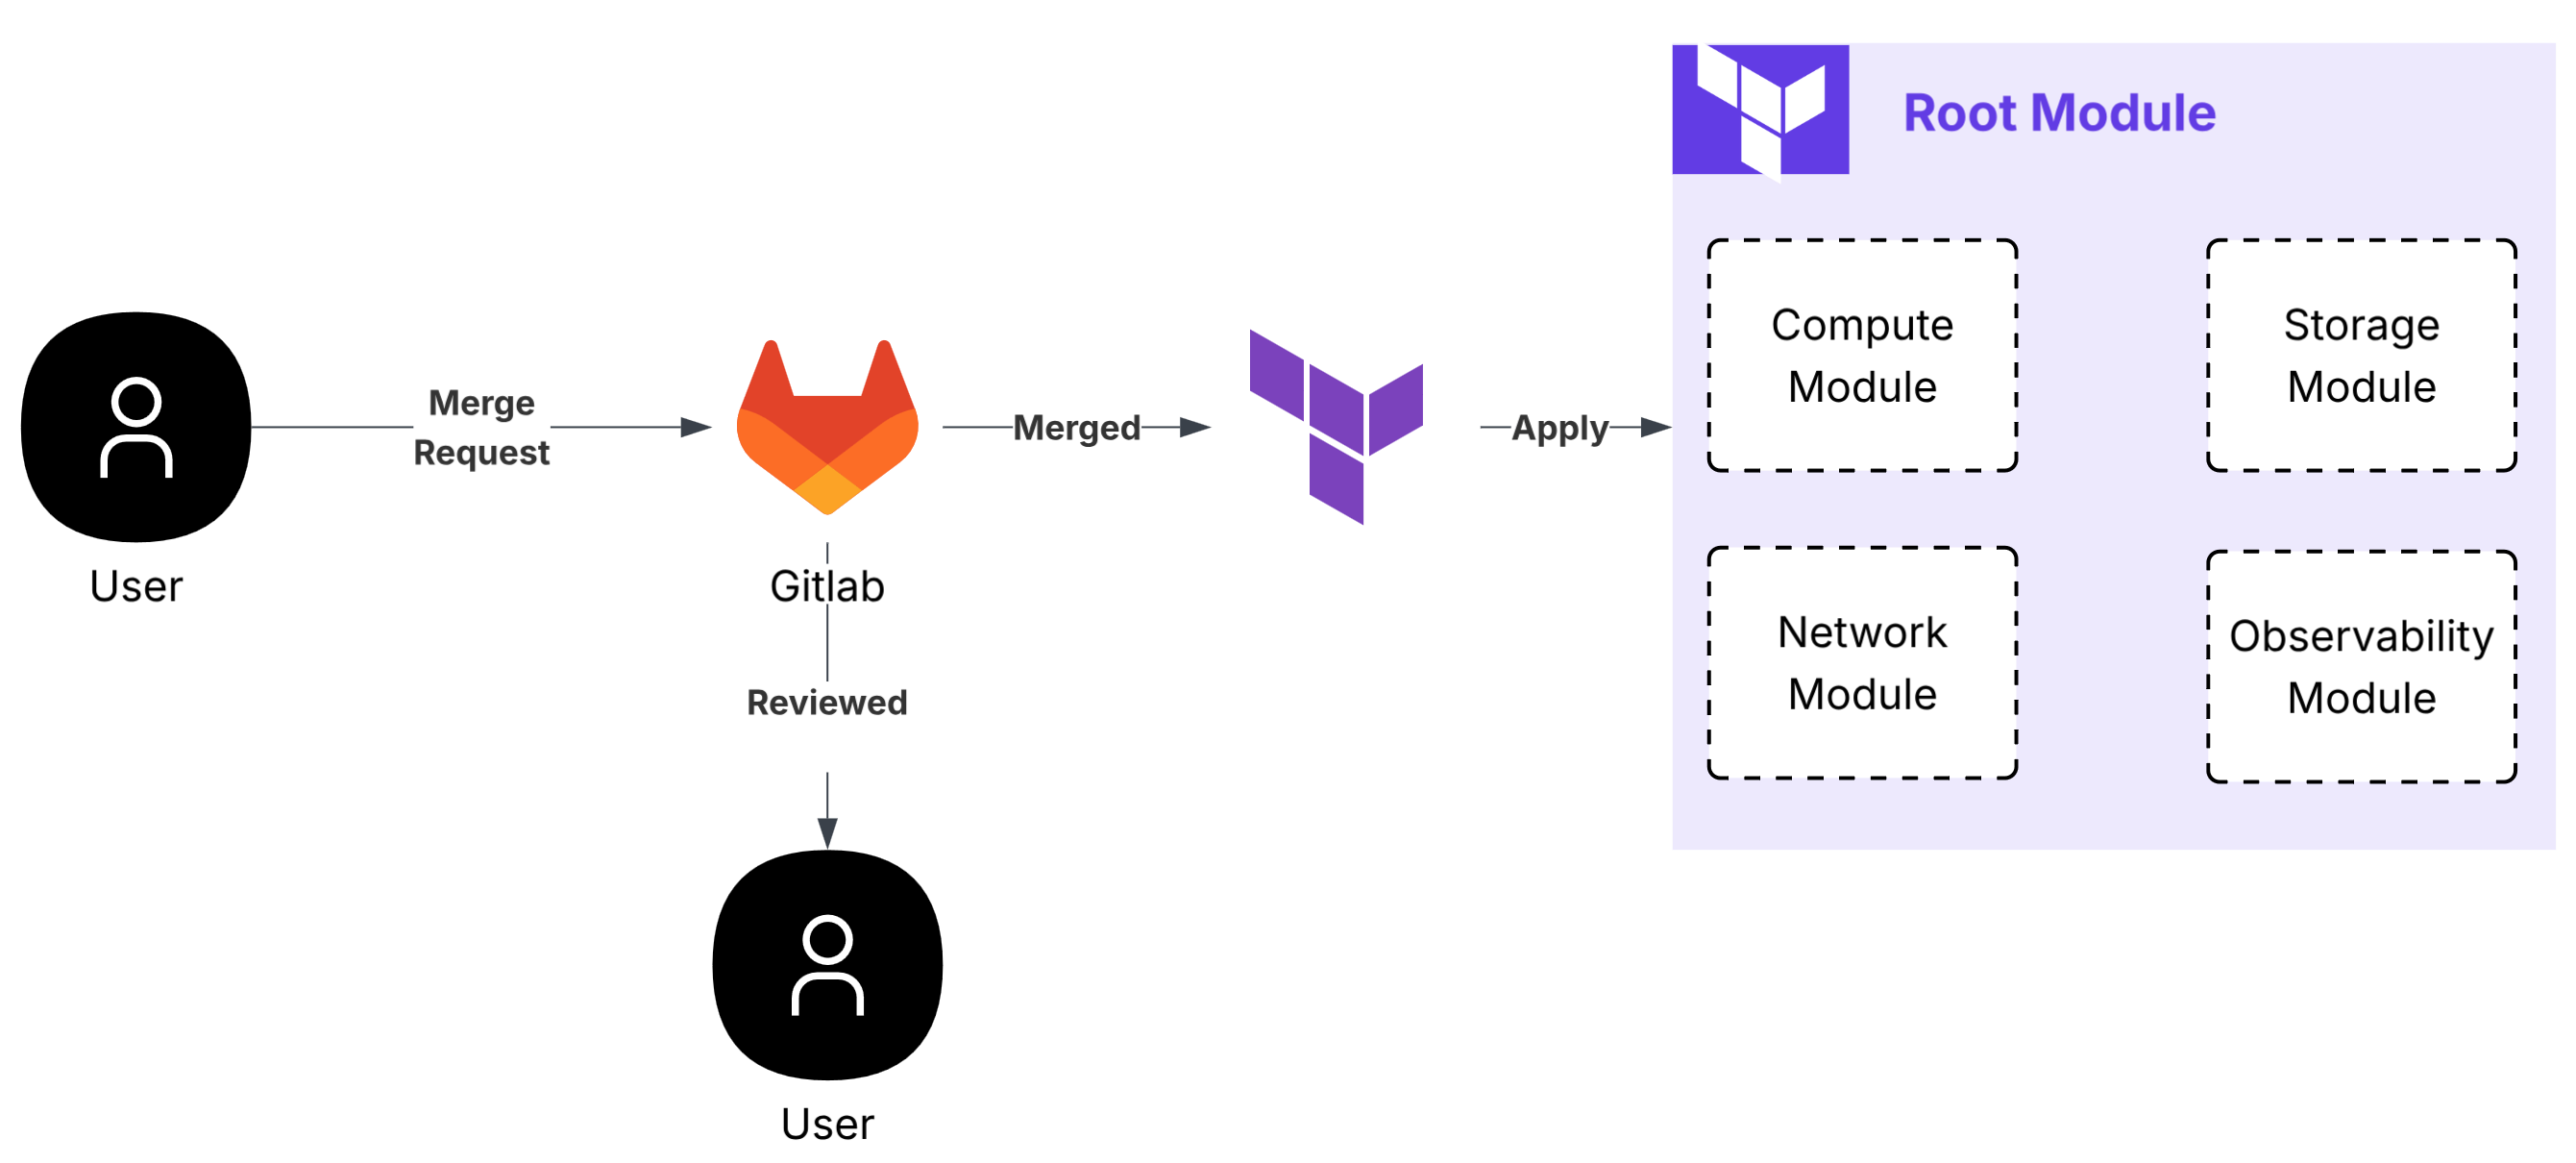
Merge request → review → merge → Terraform apply → root module that includes compute, storage, network, and an observability module together.
For the platform jobs themselves (Layer 2), the companion flow is Nomad-shaped rather than Terraform-shaped:
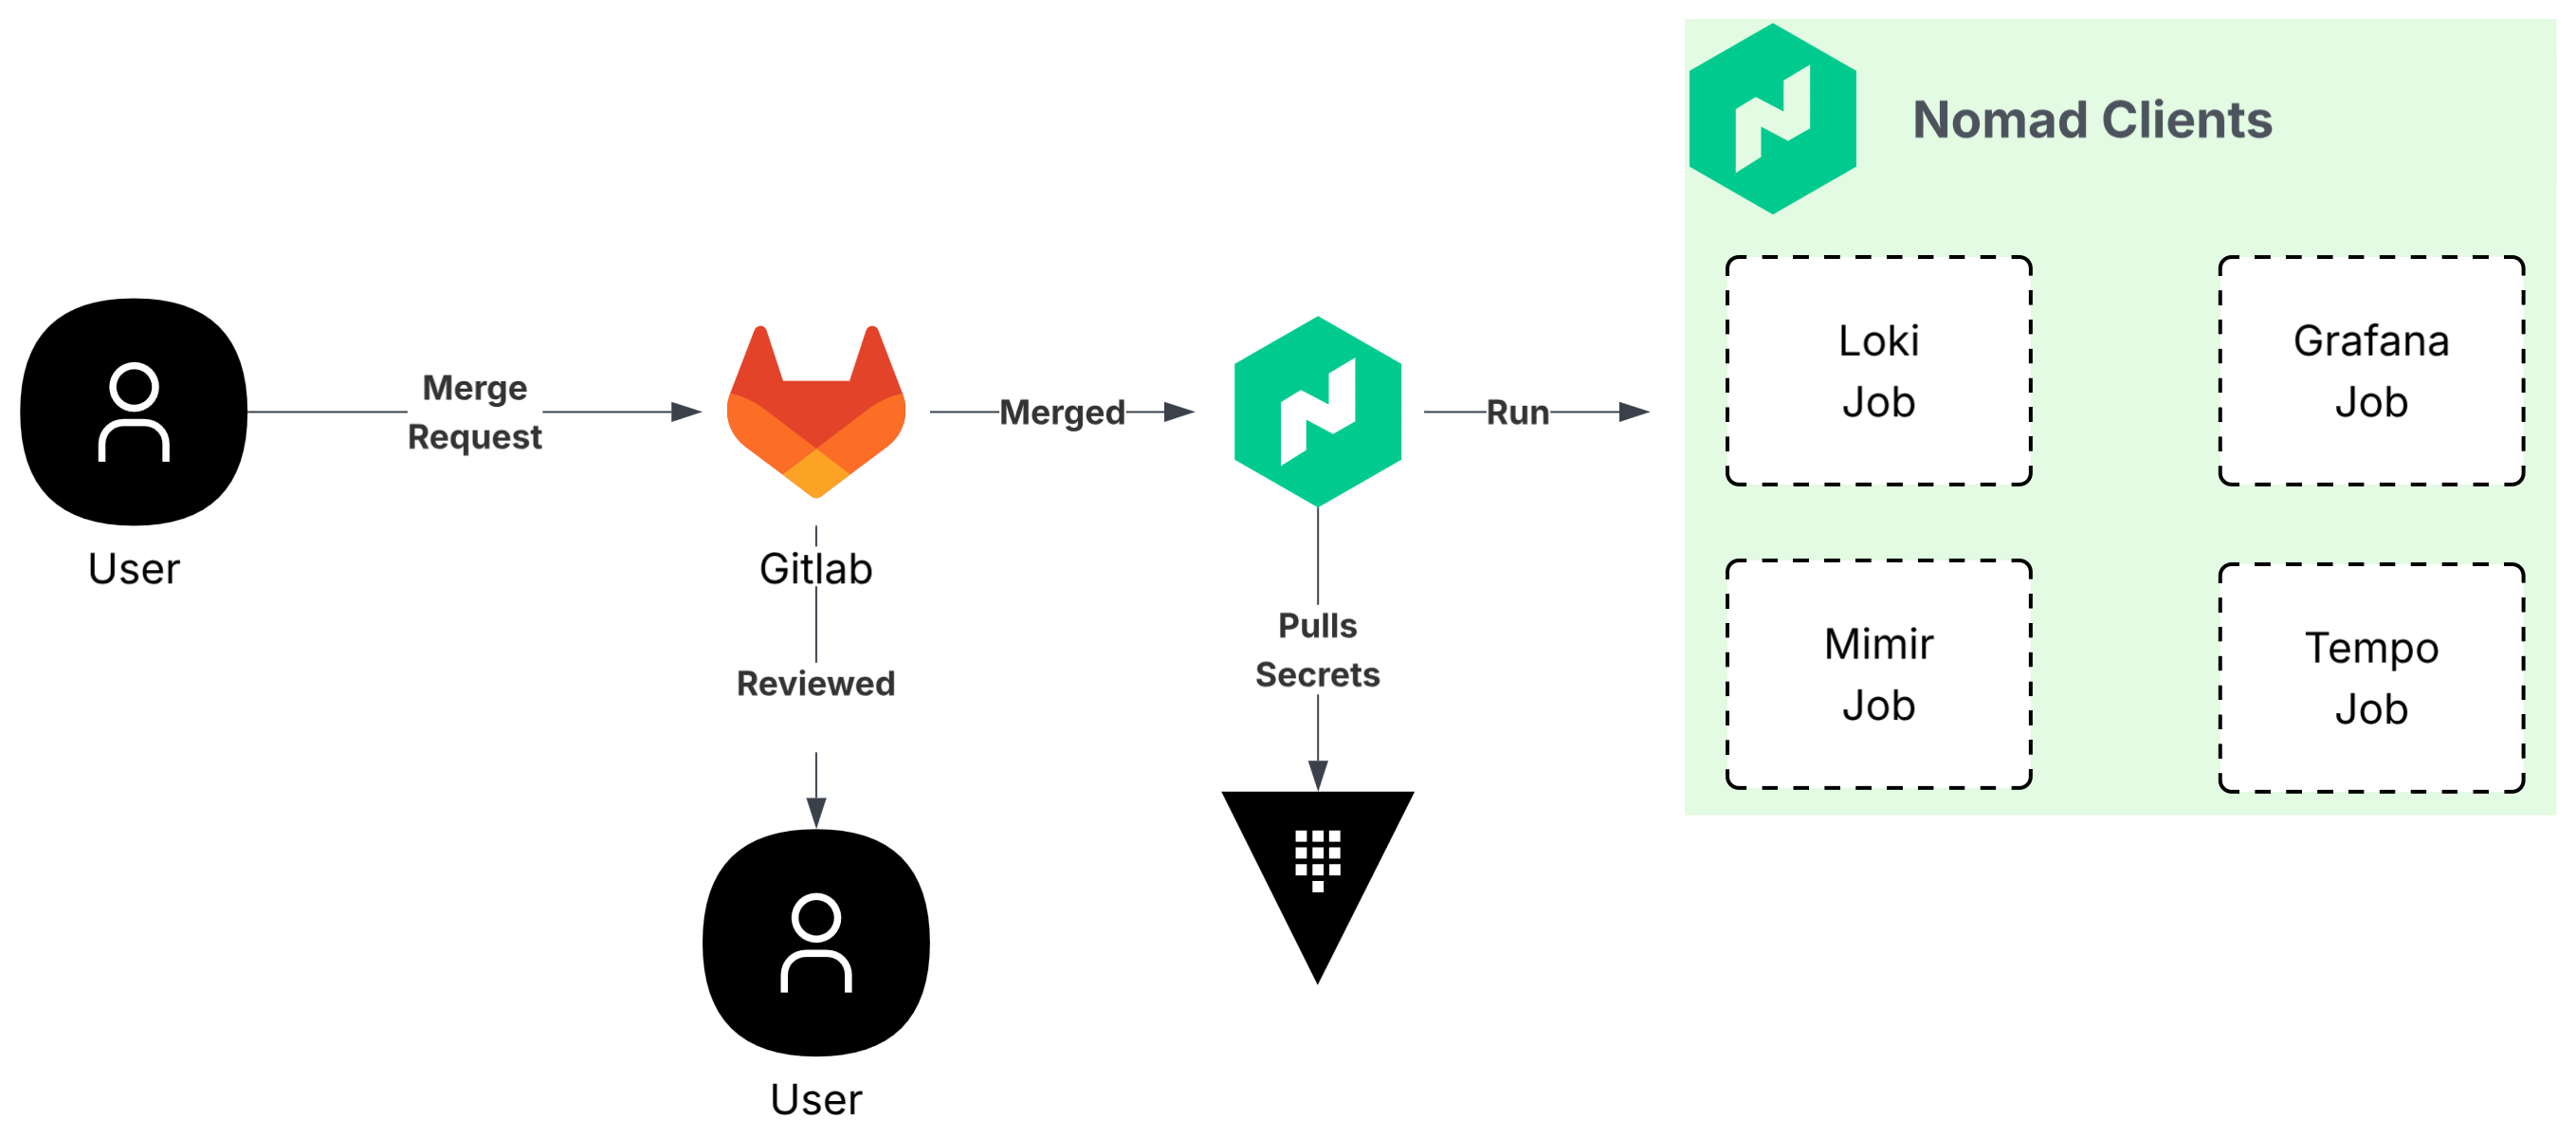
Same idea, different executor: reviewed config becomes the running system without a manual Grafana session.
The Lab Root Module
3-terraform is intentionally small. One apply wires Grafana resources and a Nomad job that keeps the dashboard honest:
locals {
  grafana_provider_auth = trimspace(var.grafana_auth) != "" ? var.grafana_auth : "${var.grafana_bootstrap_username}:${var.grafana_bootstrap_password}"
}

module "grafana_stack" {
  source = "./modules/grafana-stack"

  demo_name           = var.demo_name
  logs_datasource_uid = var.logs_datasource_uid
  log_marker          = var.log_marker
}

module "nomad_logger" {
  source = "./modules/nomad-logger"

  demo_name         = var.demo_name
  nomad_datacenters = var.nomad_datacenters
  log_marker        = var.log_marker
}
grafana_stack owns team, folder, permissions, dashboard, and a service-account token. nomad_logger owns a busybox job that emits marked log lines so Loki has something to show.
Team, Folder, Permissions, Dashboard
From modules/grafana-stack/main.tf:
resource "grafana_team" "demo" {
  name = local.team_name
}

resource "grafana_folder" "demo" {
  title                        = local.folder_title
  prevent_destroy_if_not_empty = true
}

resource "grafana_folder_permission" "demo" {
  folder_uid = grafana_folder.demo.uid

  permissions {
    role       = "Admin"
    permission = "Admin"
  }

  permissions {
    team_id    = tostring(grafana_team.demo.id)
    permission = "Edit"
  }
}
The dashboard is built with jsonencode so queries can interpolate Terraform variables. The Loki panels filter on var.log_marker — the same marker the logger job prints:
resource "grafana_dashboard" "demo_logs" {
  folder    = grafana_folder.demo.uid
  overwrite = true
  message   = "Manage demo log dashboard with Terraform"

  config_json = jsonencode({
    uid   = local.dashboard_uid
    title = "${var.demo_name} Log Stream"
    tags  = ["demo", "logs", var.demo_name]
    panels = [
      {
        id    = 1
        type  = "stat"
        title = "Matching Logs (Last 5m)"
        # ...
        targets = [{
          expr = "sum(count_over_time({job=\"docker-logs\"} |= \"${var.log_marker}\" [5m]))"
        }]
      },
      {
        id    = 2
        type  = "logs"
        title = "Generated Demo Logs"
        # ...
        targets = [{
          expr = "{job=\"docker-logs\"} |= \"${var.log_marker}\""
        }]
      }
    ]
  })
}
Change the marker in one place; both the generator and the dashboard stay aligned. That is the point of co-deploying.
Bootstrap Auth Without a Chicken-and-Egg
Fresh Grafana often only has admin:admin. The root module accepts either a real token or bootstrap basic auth:
provider "grafana" {
  url  = var.grafana_url
  auth = local.grafana_provider_auth
}
On first apply, leave grafana_auth empty. Terraform creates a service account and token. Capture it and reuse it:
cd 3-terraform
./run.sh

terraform output -raw grafana_terraform_service_account_token
export TF_VAR_grafana_auth="<token>"
terraform apply
After that, stop living on the default admin password for automation.
The Logger That Feeds the Dashboard
modules/nomad-logger renders a Nomad job from a template:
resource "nomad_job" "demo_logger" {
  jobspec = templatefile("${path.module}/nomad-job.nomad.tpl", {
    job_name    = local.job_name
    datacenters = jsonencode(var.nomad_datacenters)
    demo_name   = var.demo_name
    log_marker  = var.log_marker
  })
}
The job is a busybox loop that prints ${log_marker} every two seconds. Alloy (Layer 4) ships those Docker logs to Loki. The dashboard filters on the same string. One terraform apply stands up the signal and the UI that watches it.
Conclusion
Layer 3 closes the handoff gap between “service is up” and “someone will make a dashboard later”:
- Put folders, teams, dashboards, and alerts in Terraform next to the service resources.
- Template queries and labels from the same variables the workload uses.
- Review observability changes in merge requests.
- Bootstrap credentials once, then automate with a service-account token.
Next: Layer 4 — Orchestration, where Alloy stops being a static systemd unit and becomes a Nomad system job.
Series
- Codified Observability: Making Monitoring Unavoidable
- Layer 1 — Images
- Layer 2 — Platforms
- Layer 3 — Provisioning (this post)
- Layer 4 — Orchestration
- Key Takeaways